As your quarterly business review approaches, you need to present a clear perspective on market growth and profitability to inform your business strategy and target-setting process. Problem? Getting the right data is tough, and you end up guessing instead of using solid facts to base the conversation on.
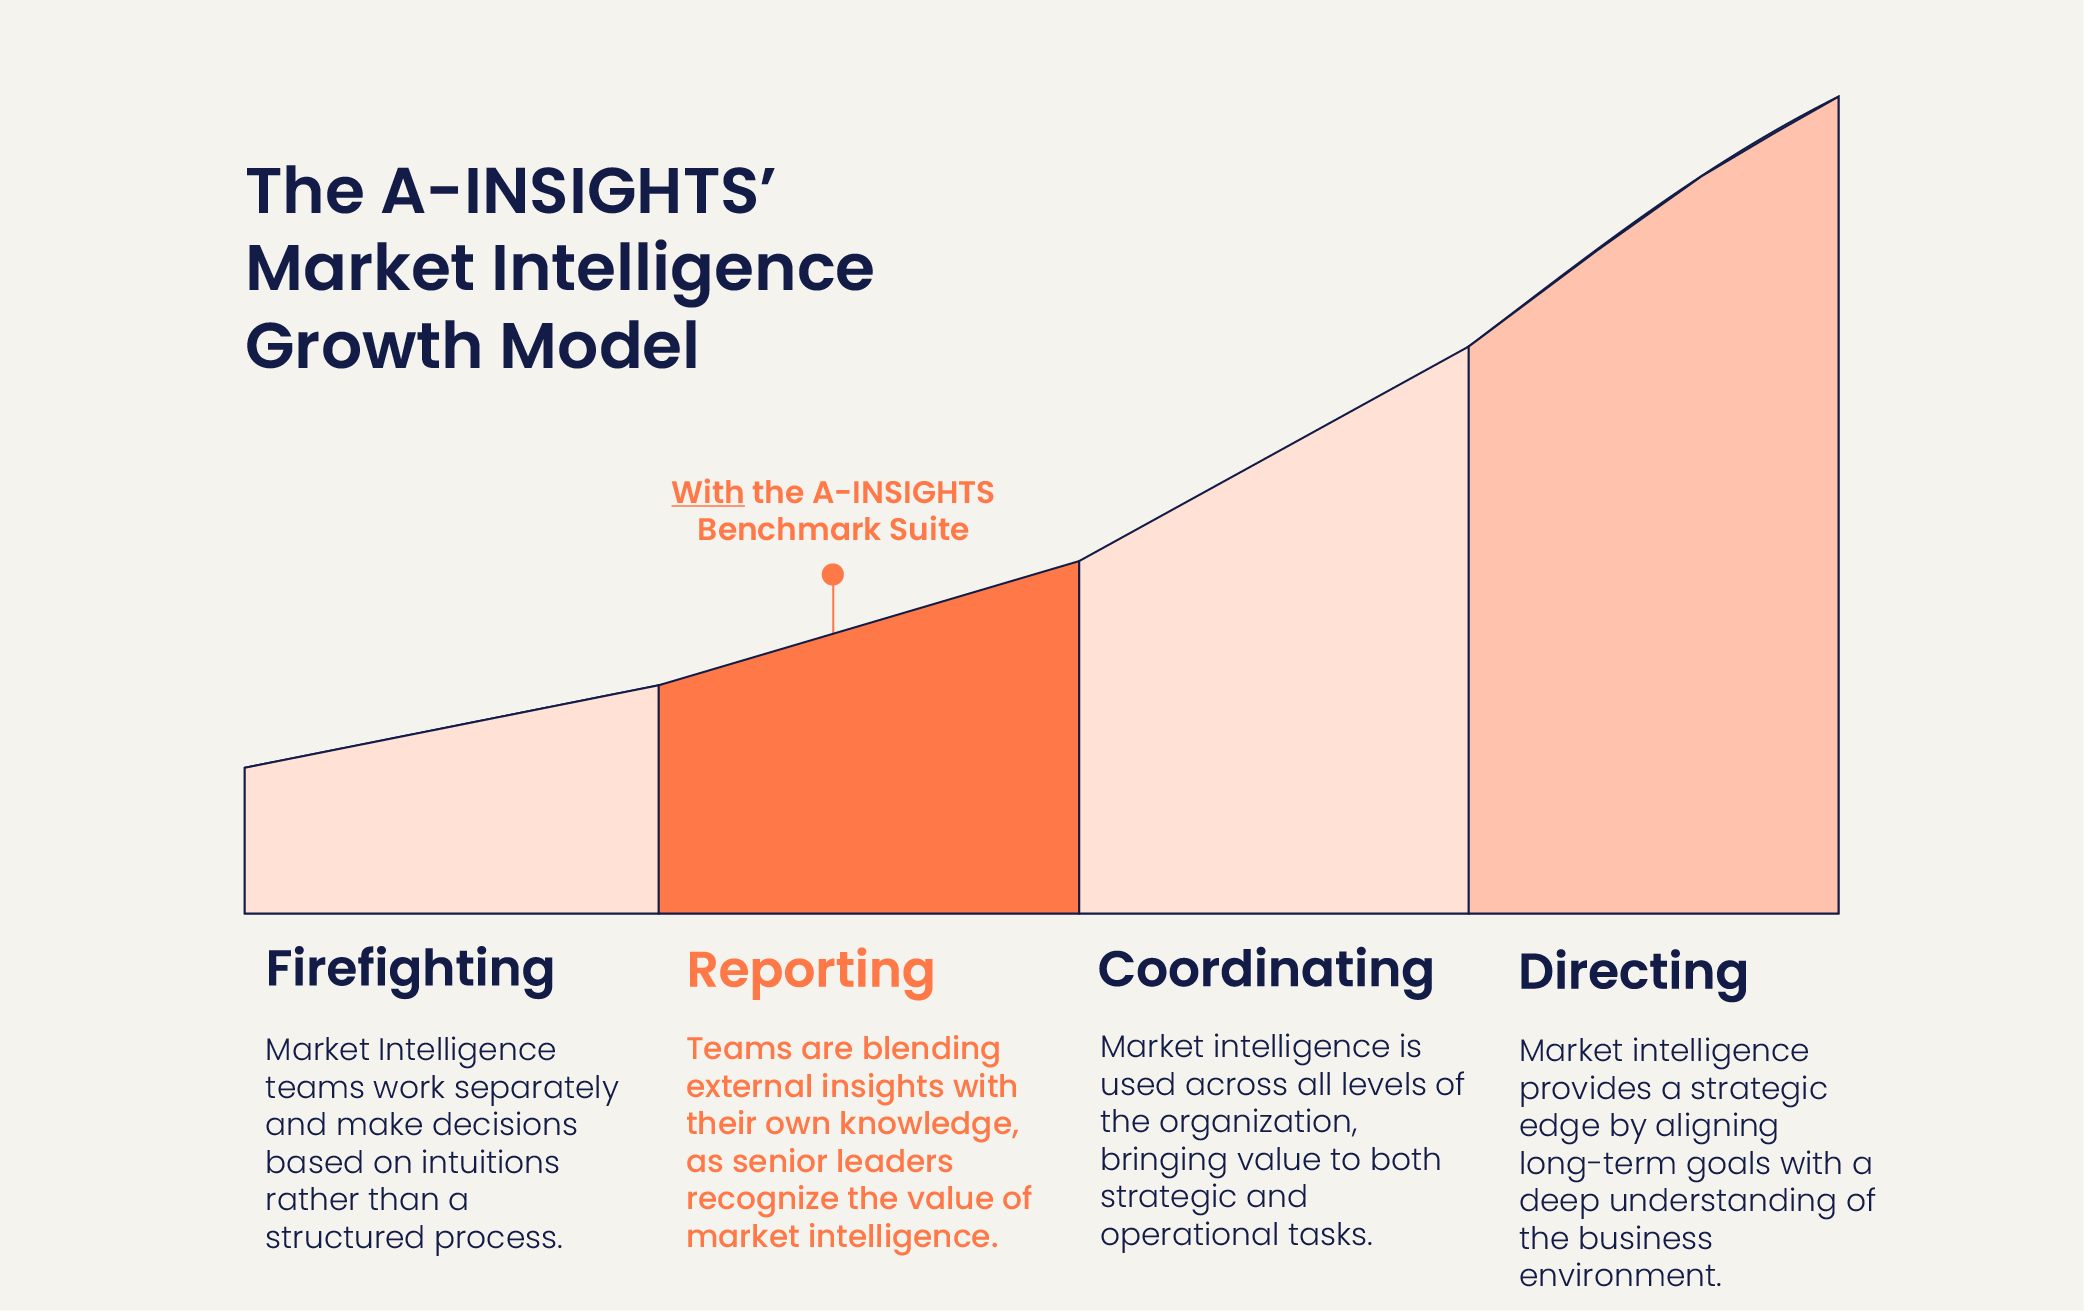
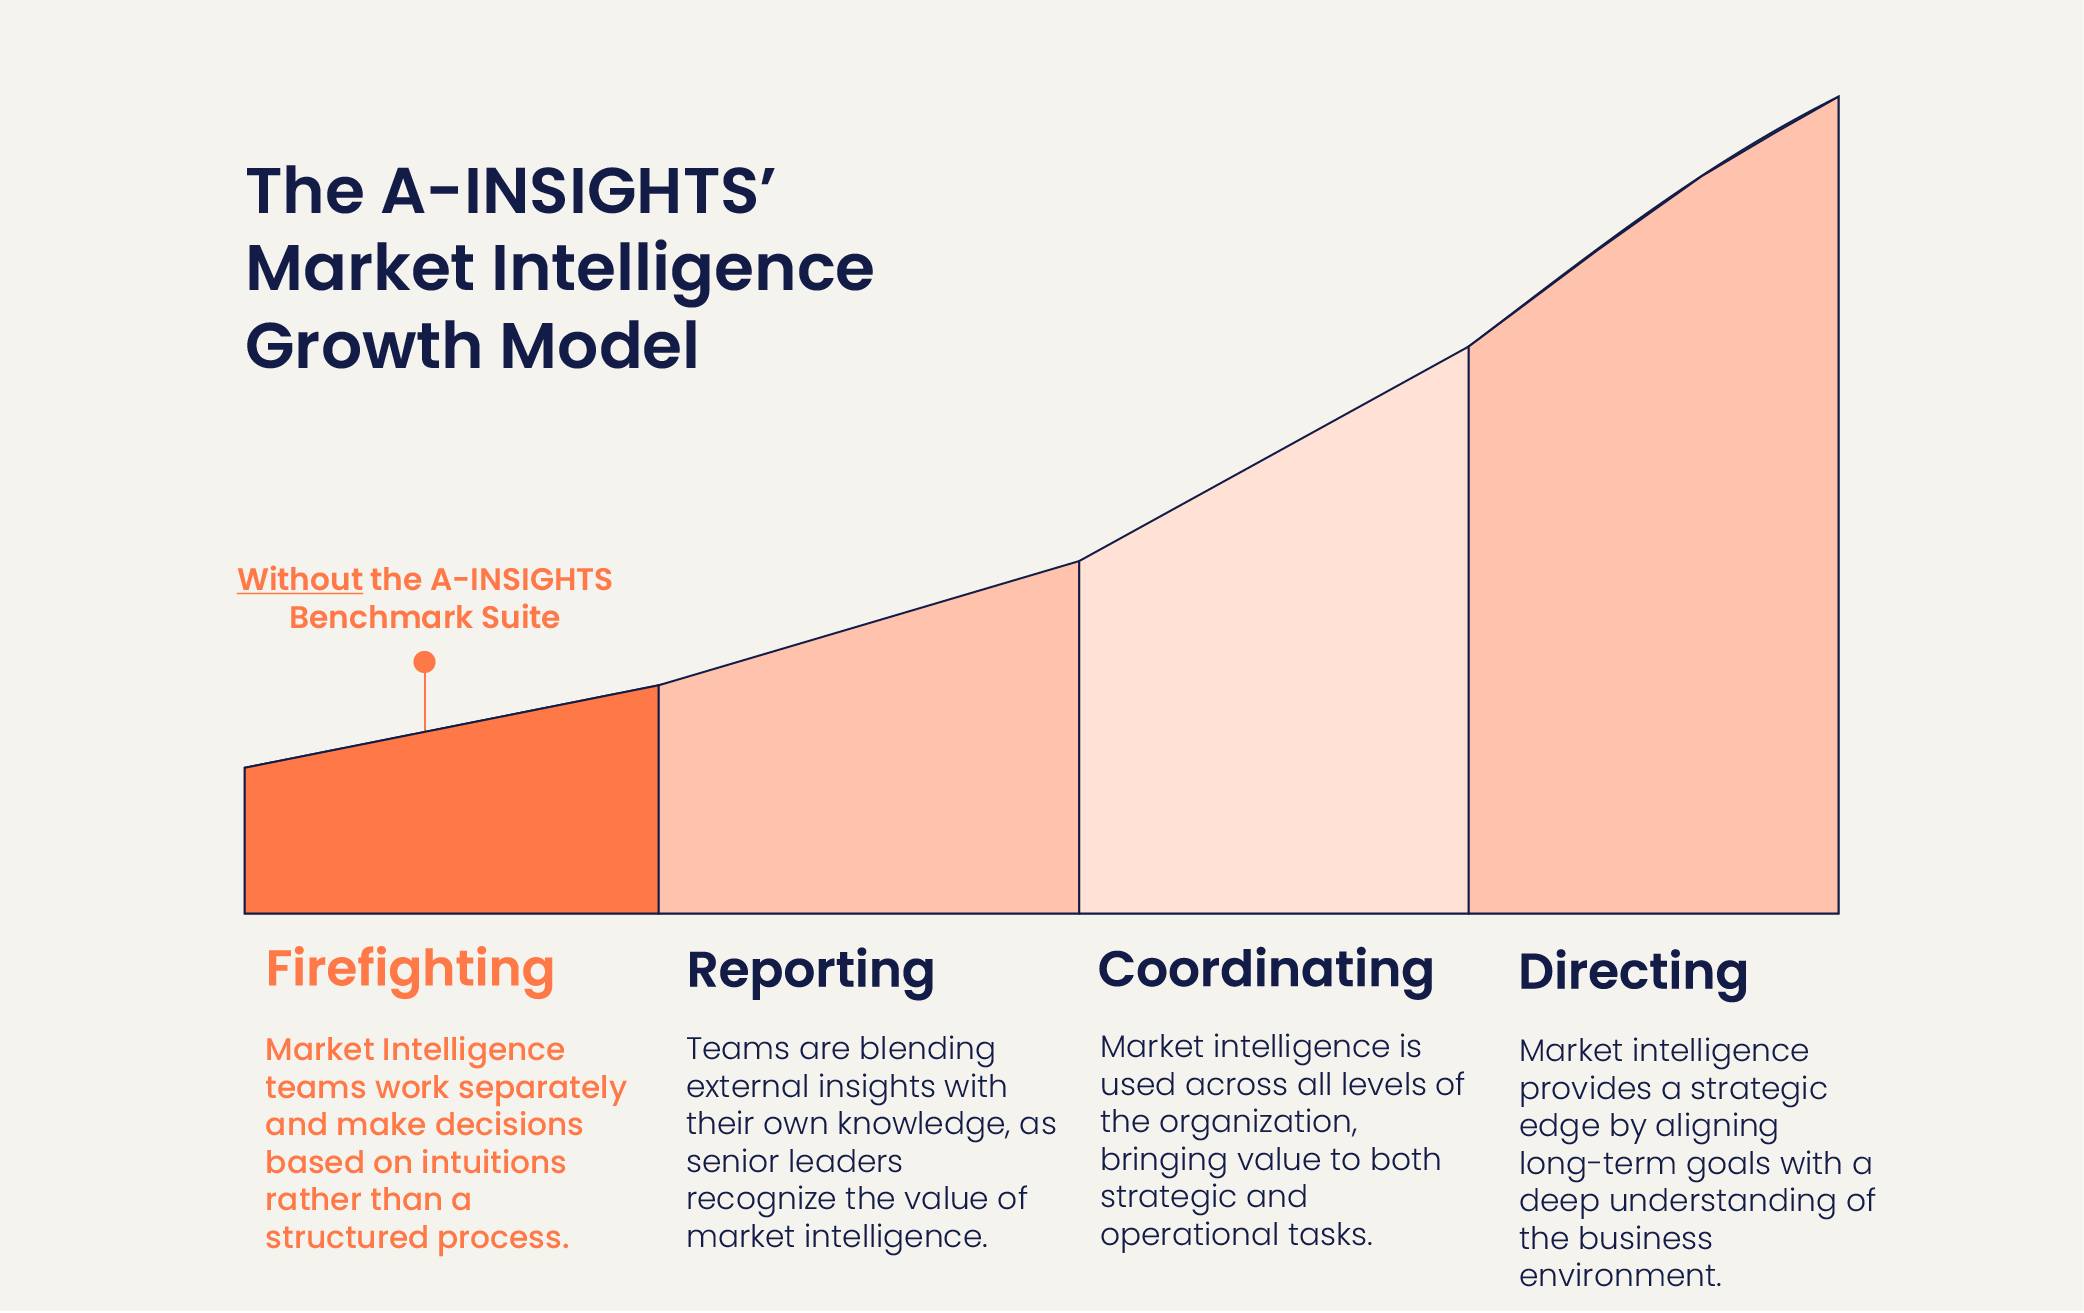
The outcome? You’re trapped in a perpetual cycle of firefighting, and cannot leverage the data to make an impact on your business.
At A-INSIGHTS, we believe in the power of data-driven market intelligence. Good news, our completely revamped Benchmarks solution is designed to help you in these key moments. We've done the hard work, so you can focus on what matters most: creating the insights that make a difference.
But what does this concretely mean for dairy professionals? In this blog, we'll walk you through the steps to move your organization from firefighting to reporting.
Competitive landscape made easy
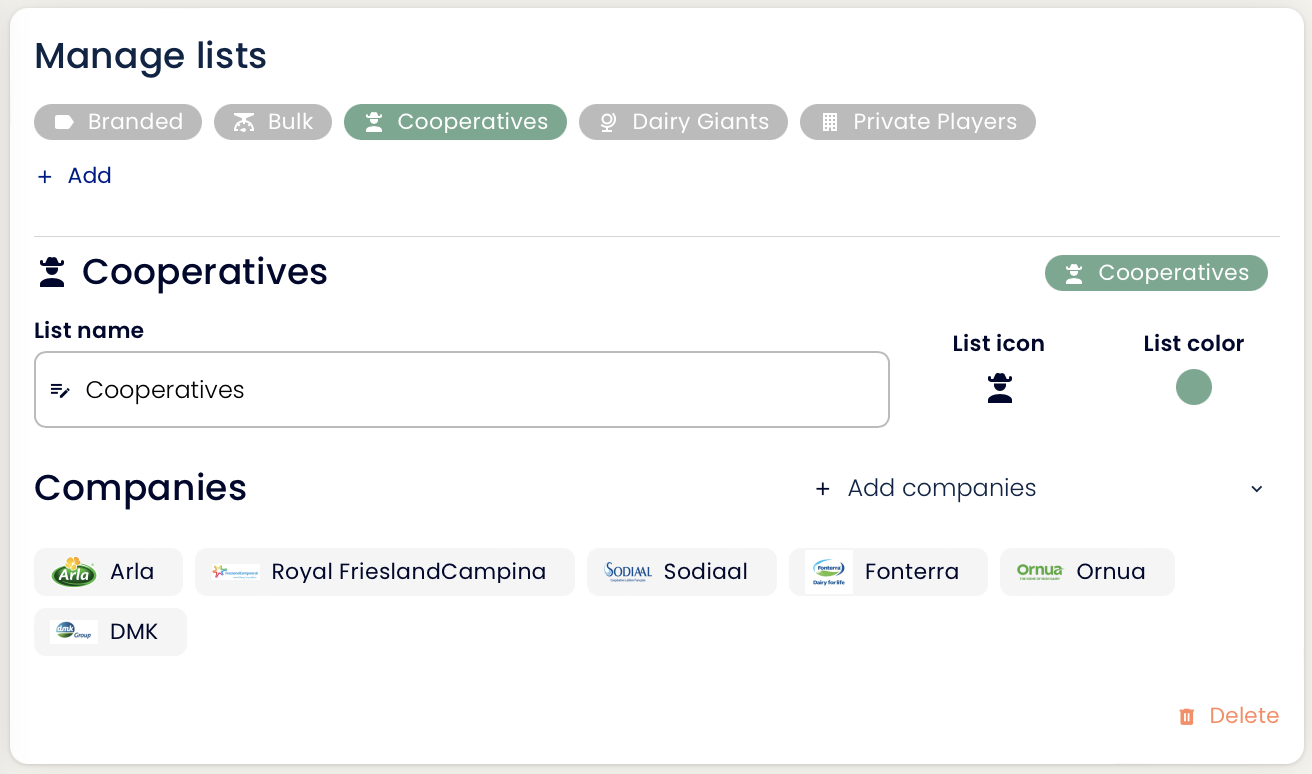
The dairy industry is particularly competitive, with various types of companies like cooperatives and private firms. Some private companies focus on building their brand, while others prioritize bulk production. Our new lists feature makes it simple to categorize and analyze these distinctions.
Let’s split up our competitive landscape as follows:
- Cooperatives: Fonterra, Royal FrieslandCampina, Arla, Sodiaal, DMK, and Ornua
- Private Players: Danone, Parmalat, Glanbia, Bel Group, Royal A-Ware, and Uelzena
Let’s dice up the Private Players in two further groups:
- Branded: Danone, Parmalat, and Bel Group
- Bulk: Glanbia, Royal A-Ware and Uelzena
Exploring use cases as a starting point
Identity fastest growers
Now that our lists are set up, let's focus on why we're analyzing: understand market growth and profitability, so we can inform the strategy going forward.
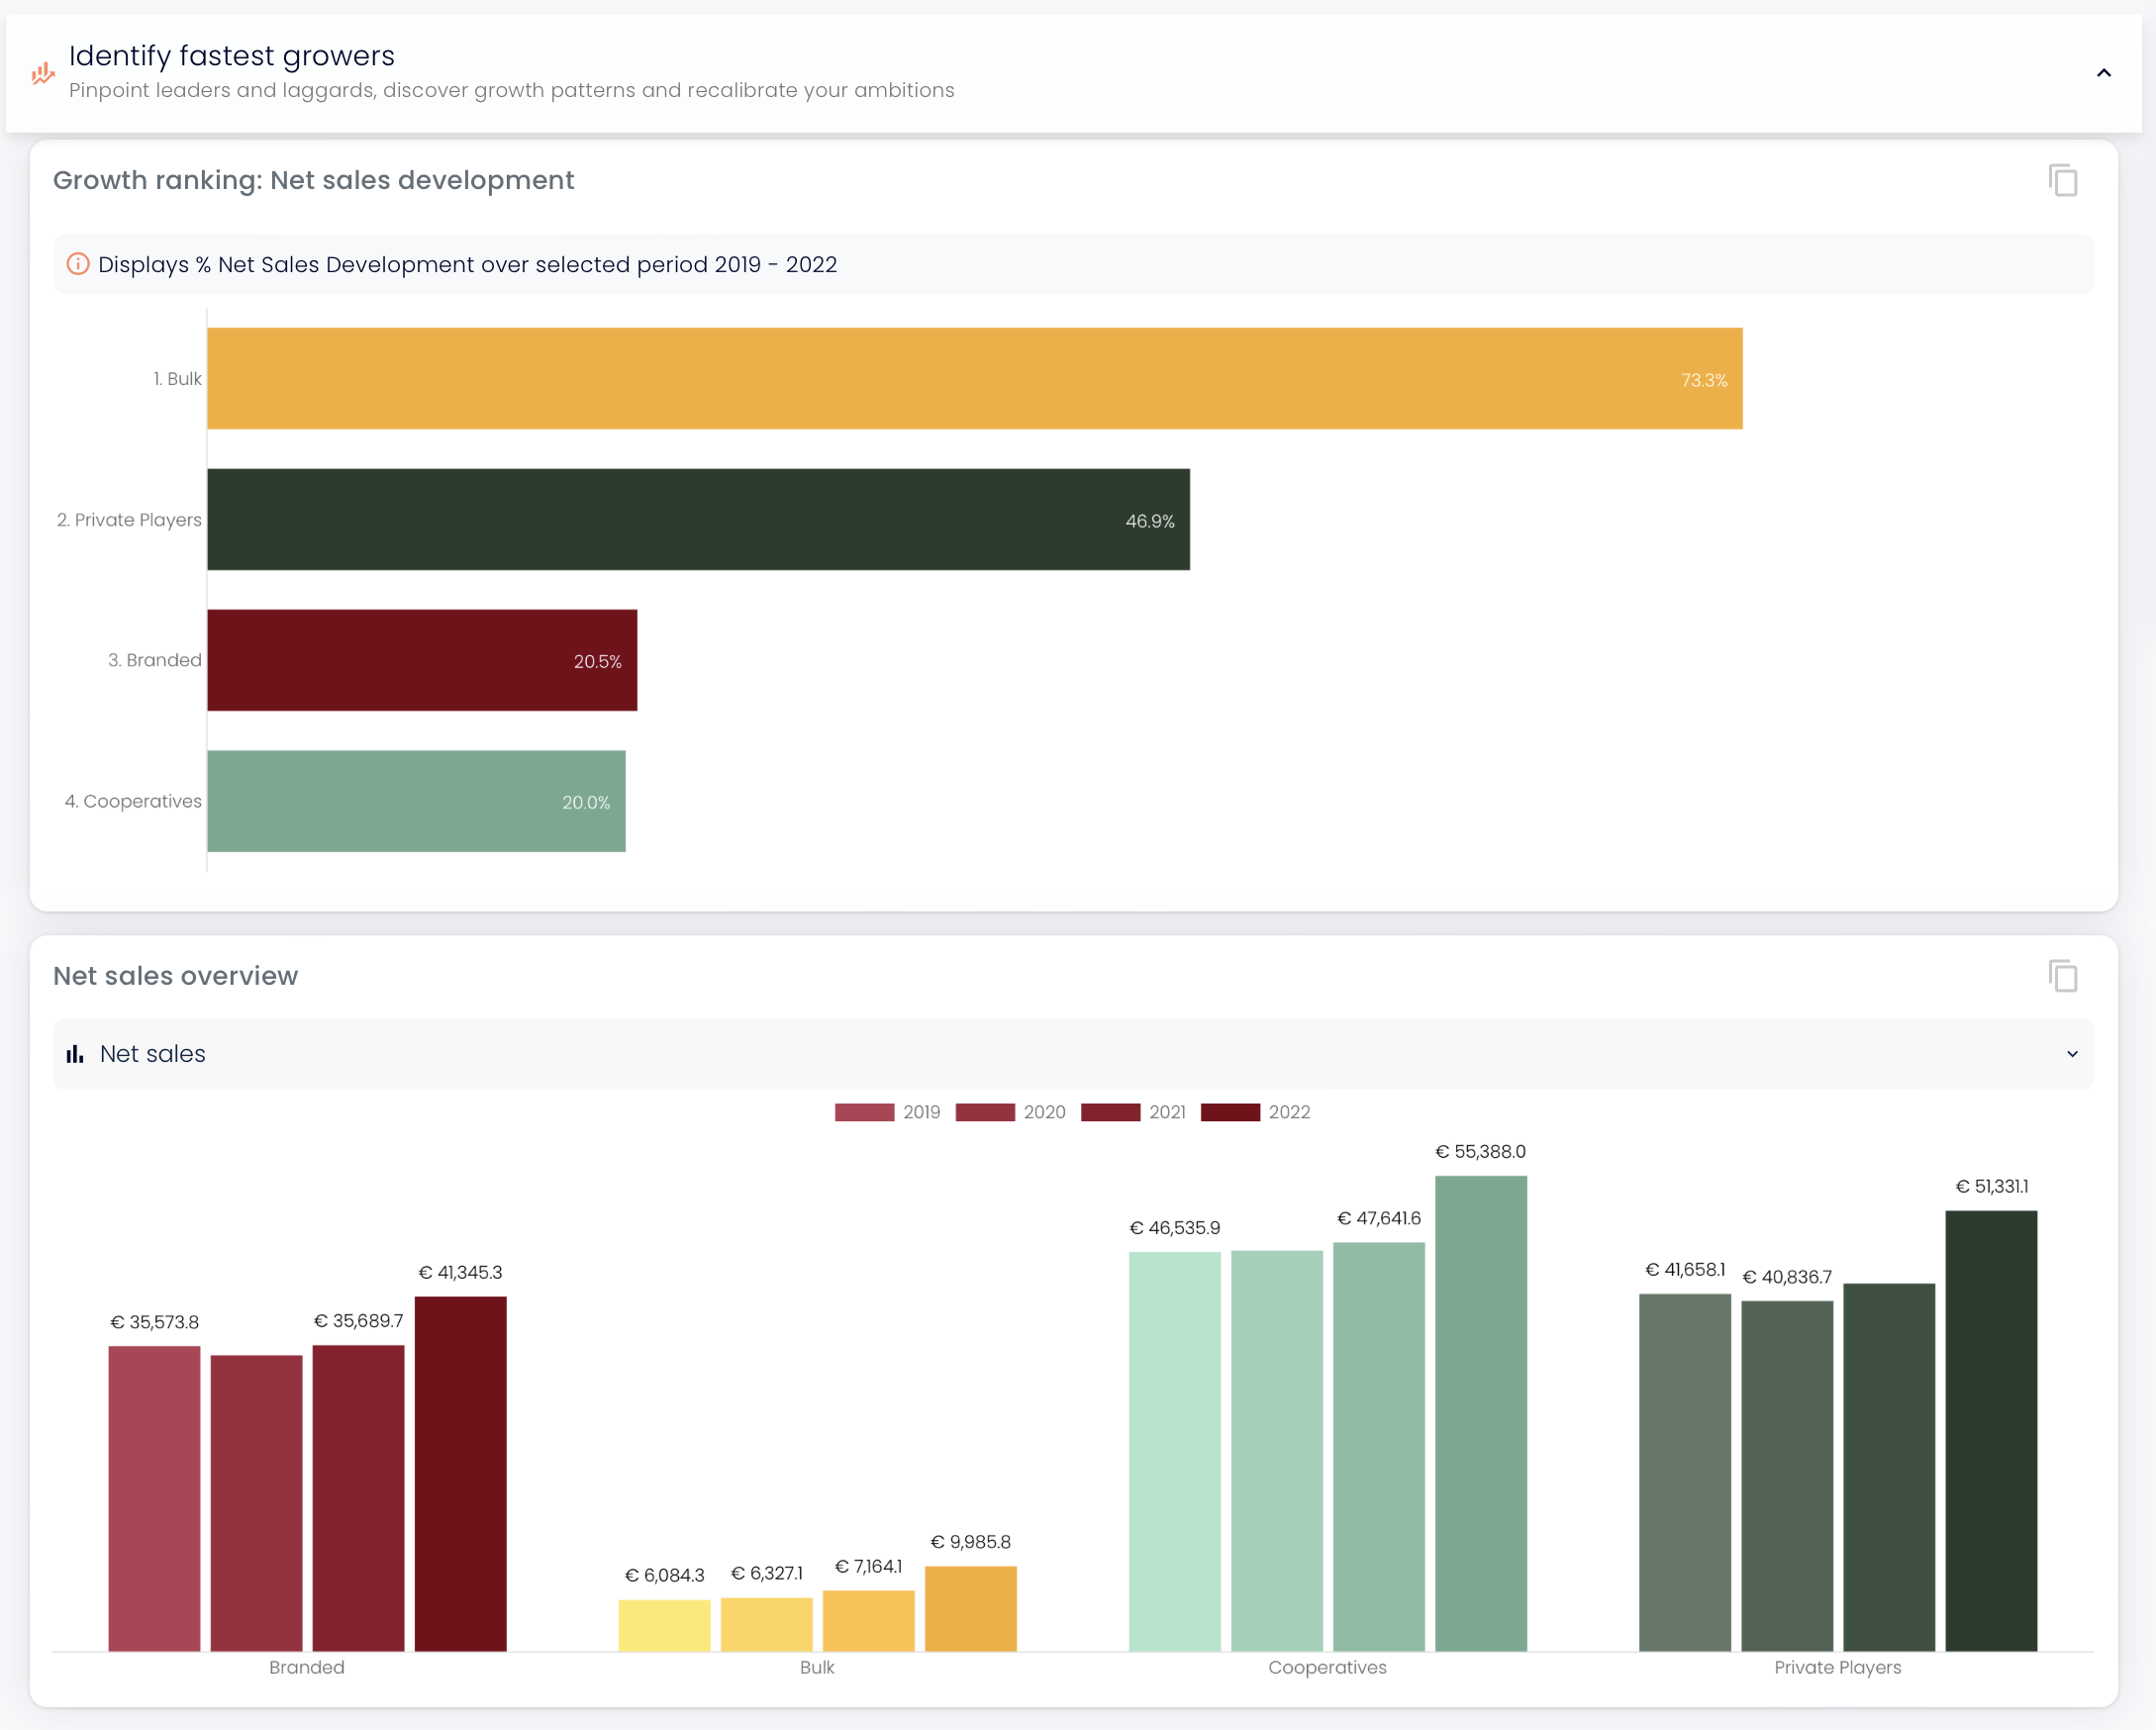
The pre-defined use cases in the A-INSIGHTS Benchmarks suite offer a solid starting point. Let's begin by looking at growth through 'Identify fastest growers' and 'Analyze market share', comparing Cooperatives with Private Players from 2019 to 2022. To differentiate between privately owned companies focusing on brands or bulk, let's add these as lists as well.
It's clear from the start that private companies have outpaced cooperatives, particularly those focusing on bulk production. This translates to a larger market share, especially noticeable in 2022, with bulk-focused companies gaining ground from other groups.
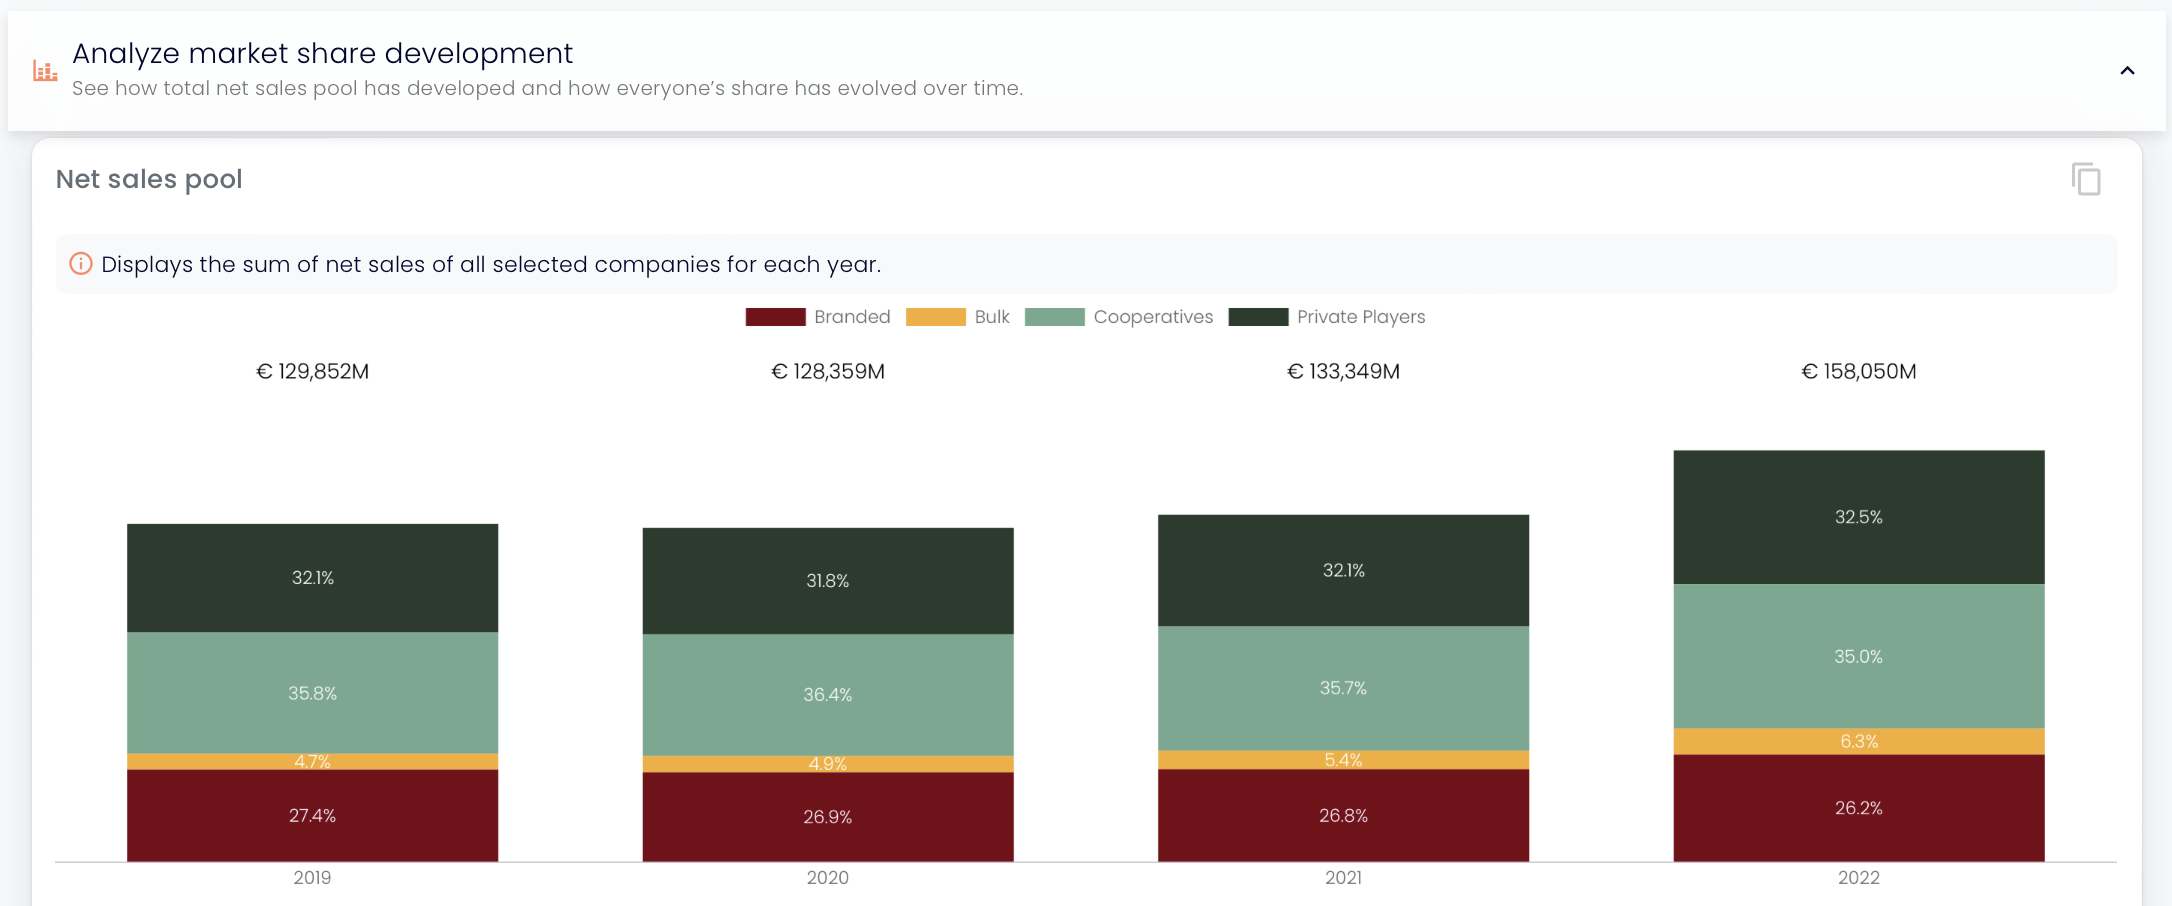
As it turns out, companies prioritizing volume over branding have done well in terms of growth during the tough period of COVID-19 and high inflation.
Investigate profitable growth
But have these companies been successful from a profit perspective, too? You can answer this question with our “Investigate profitable growth” use case.
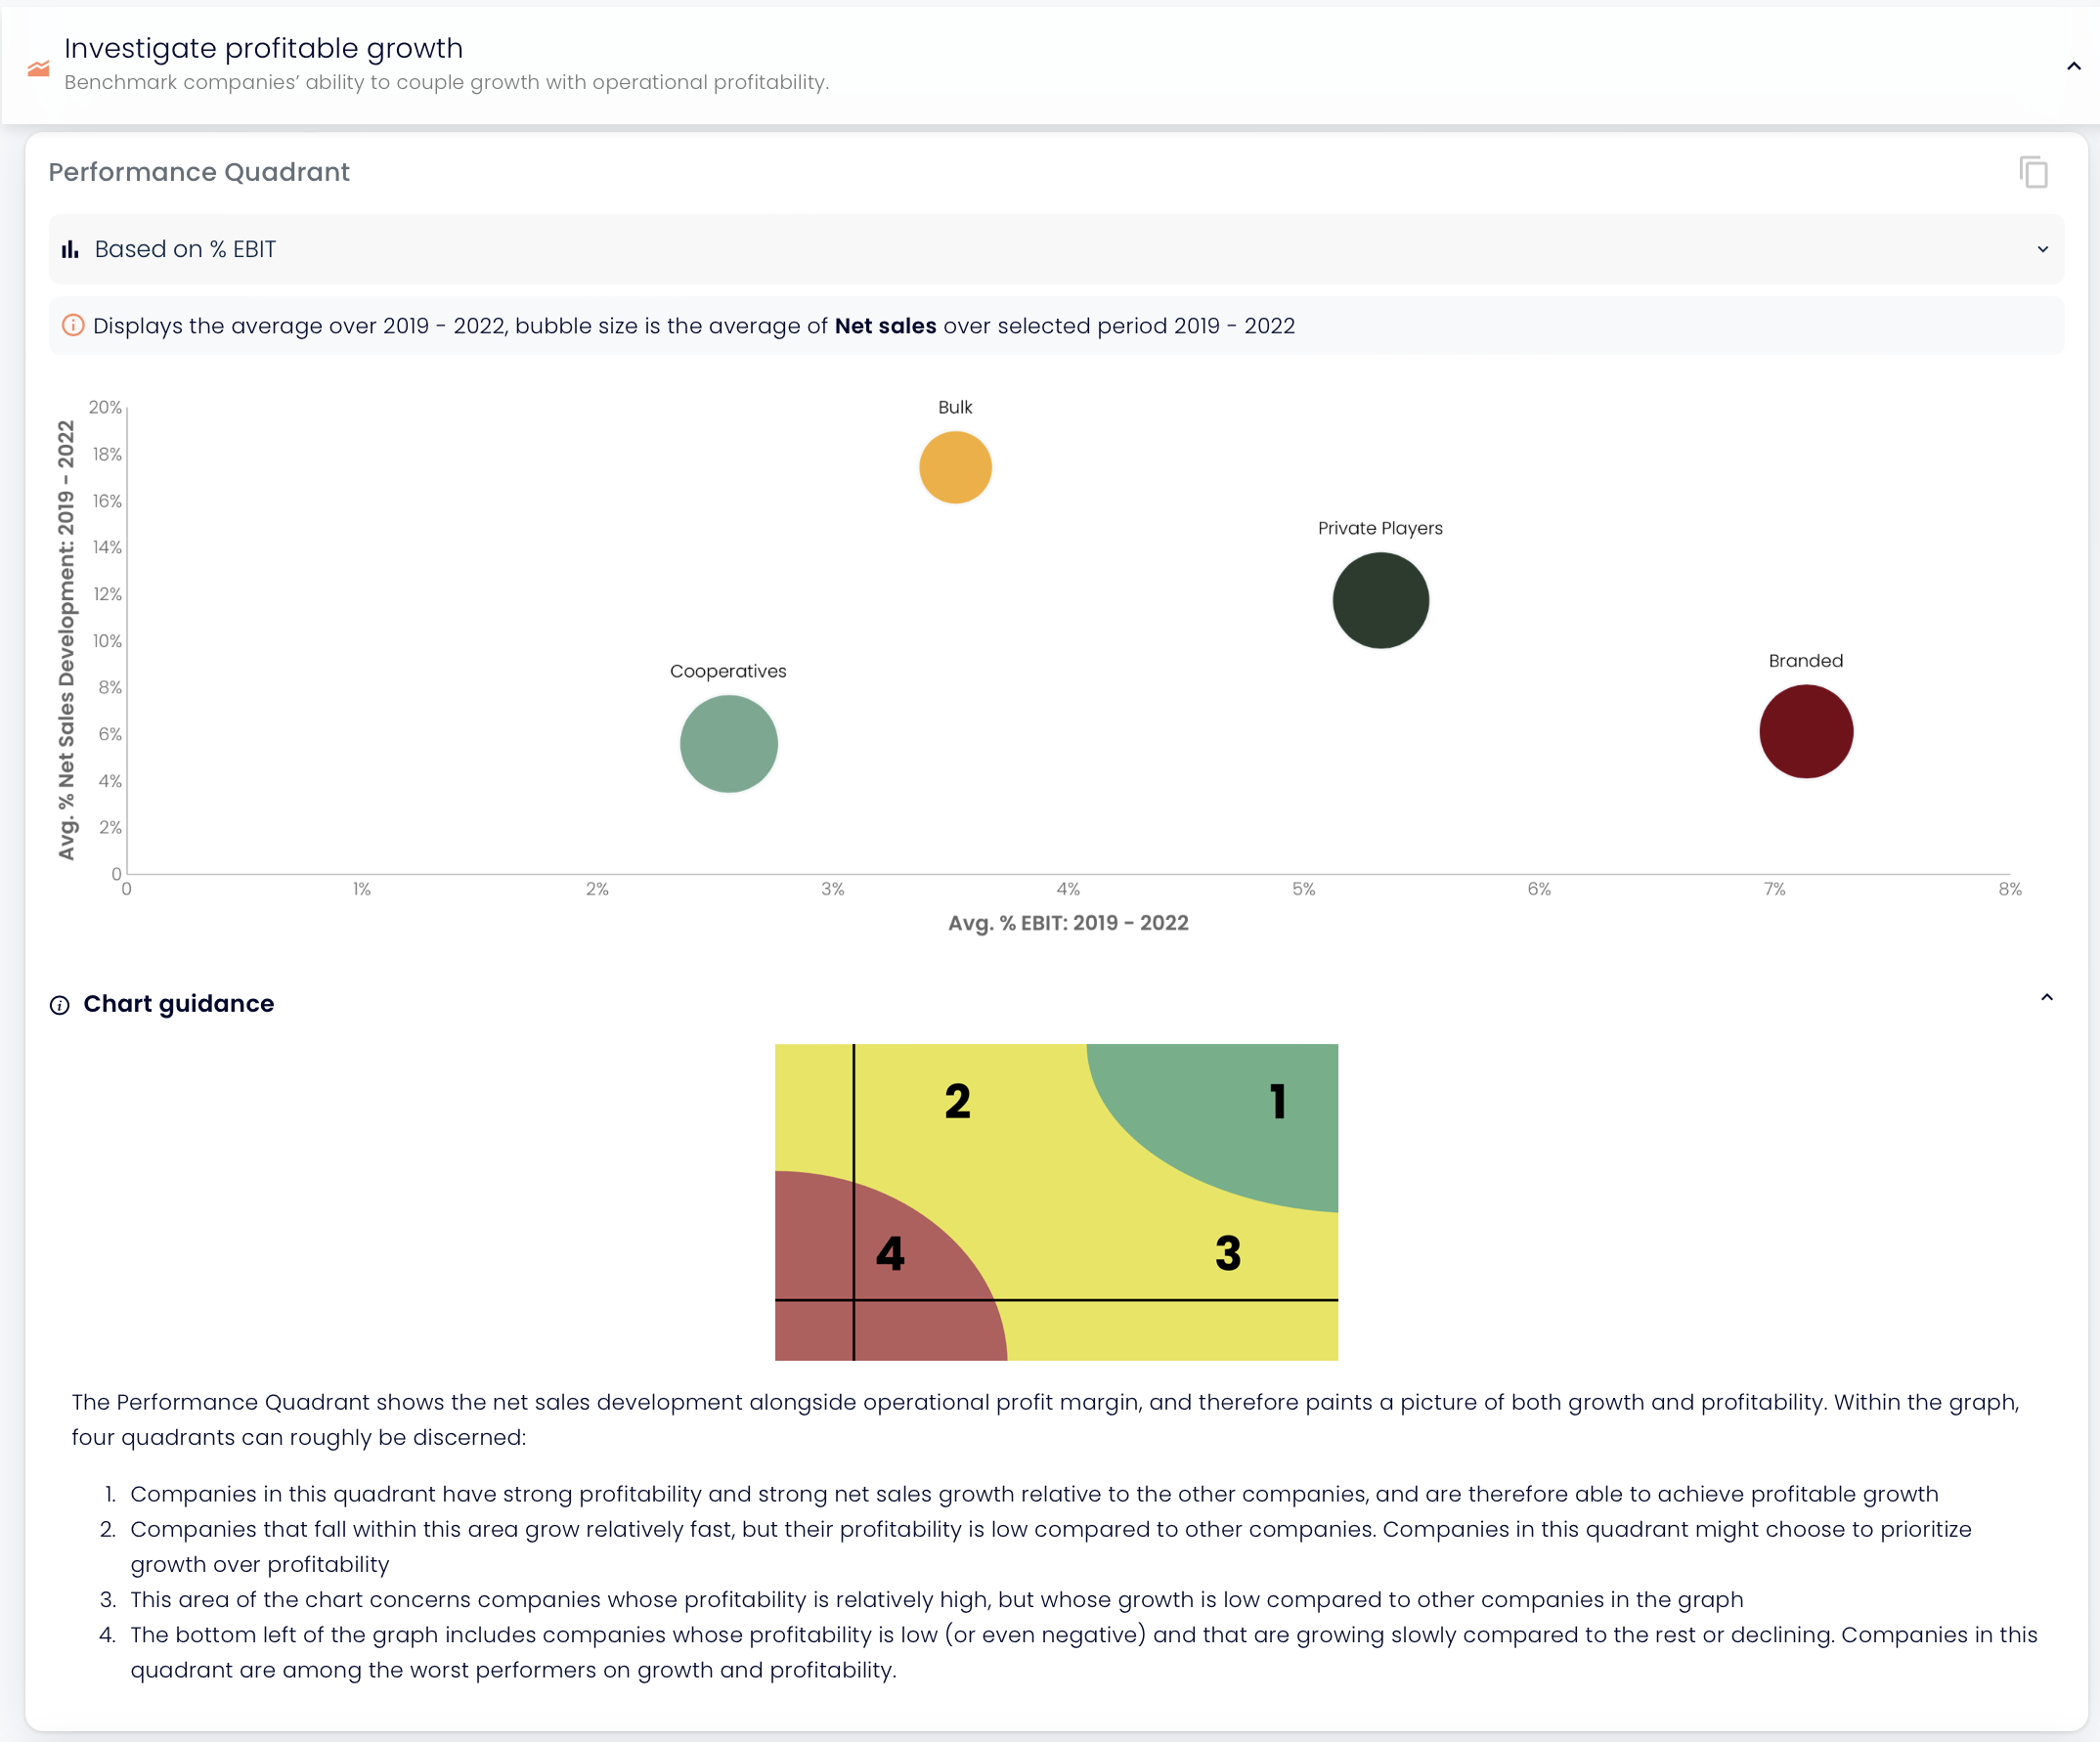
Making use of the chart guidance, we see that the Cooperatives list is the only one that has succeeded in growing operational profit alongside net sales. The private companies have lost margin, especially the Branded players.
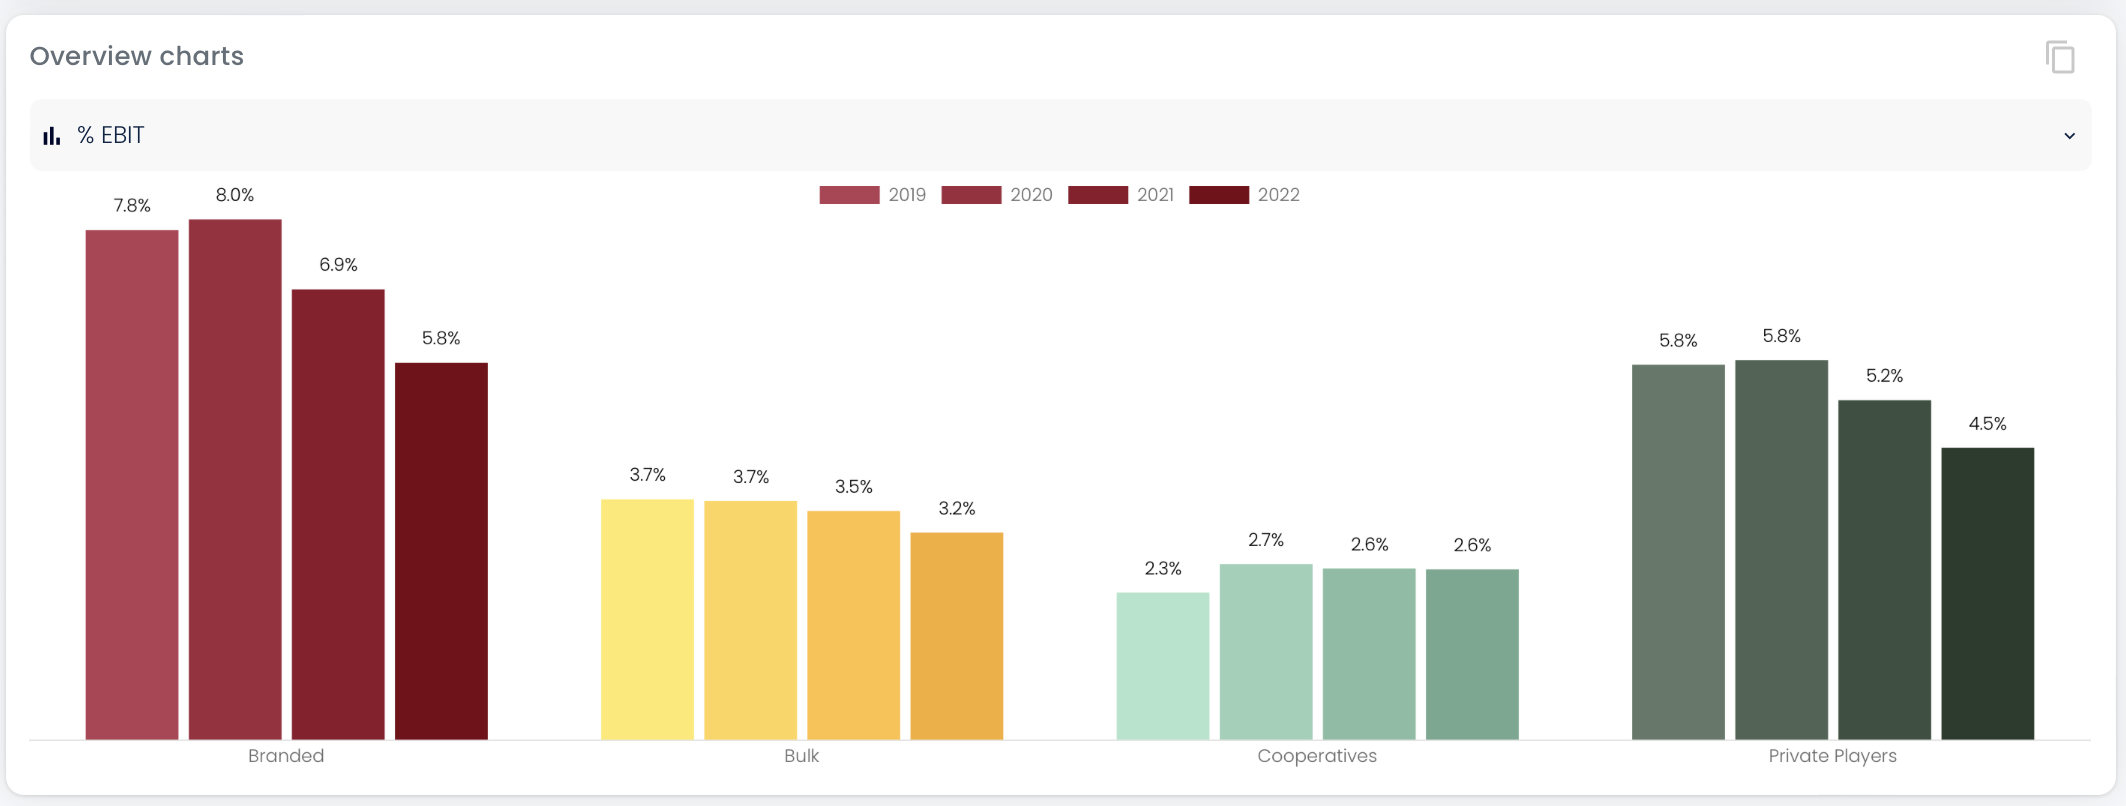
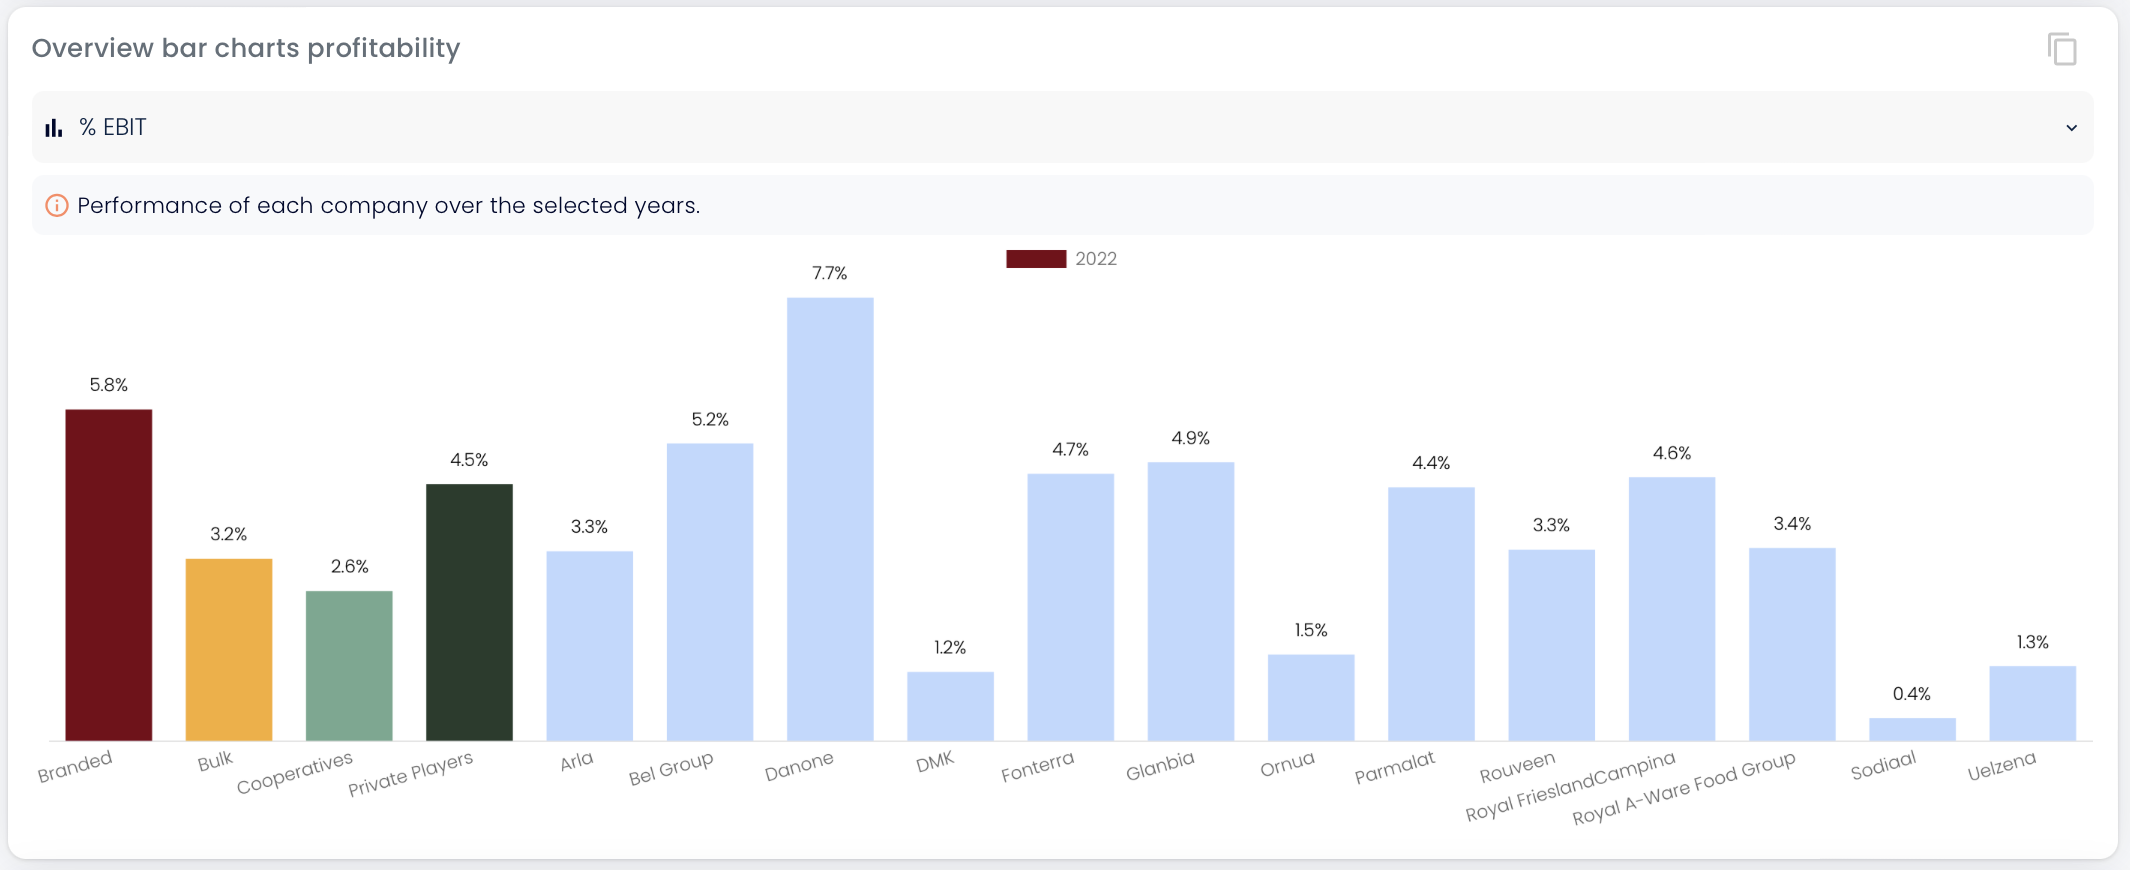
What about the EBIT margins? With pressure on the raw milk pool, it is important to be able to generate more value with less milk. Interestingly, while the Branded players had the highest margins, they’re also declining fastest. The margins of the bulk players are a lot lower and declining, but to a smaller extent. Meanwhile, the dairy cooperatives keep up their EBIT margins, in line with their strategy of maintaining steady pay-outs to their members.
From lists and use cases to detailed analysis
The lists and use cases have been a very useful starting point. By making some groupings and exploring use cases, we’ve learned the following in a matter of minutes:
• Growth has been strong overall, with bulk players leading the way and gaining market share.
• However, there's pressure on profits: Branded players, previously the most profitable, are seeing rapid declines.
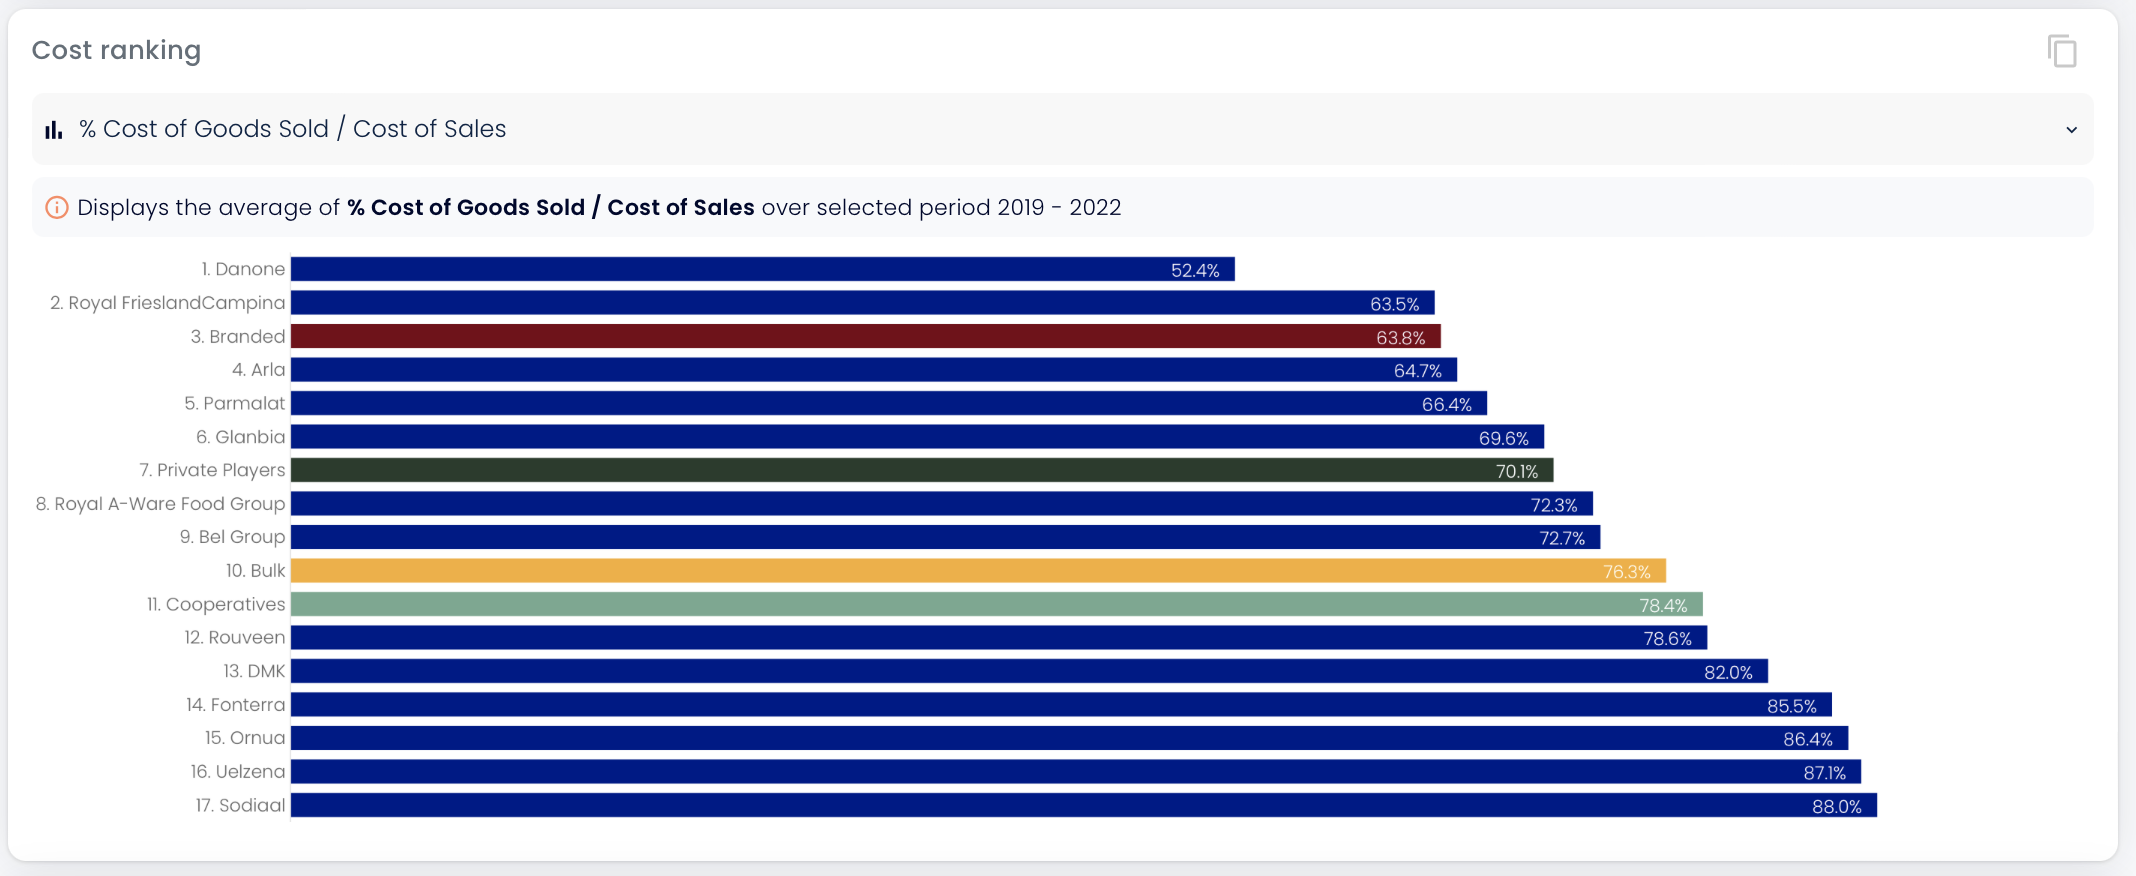
We can use these insights to discuss strategy: What strategies have been successful recently, and what do we expect for the future? Next, we can delve deeper to gain more insight. For example, we can examine the factors influencing EBIT margin changes by looking at gross margin and operating expenses. We can visualize the performance of all companies in our lists to identify the top performers.
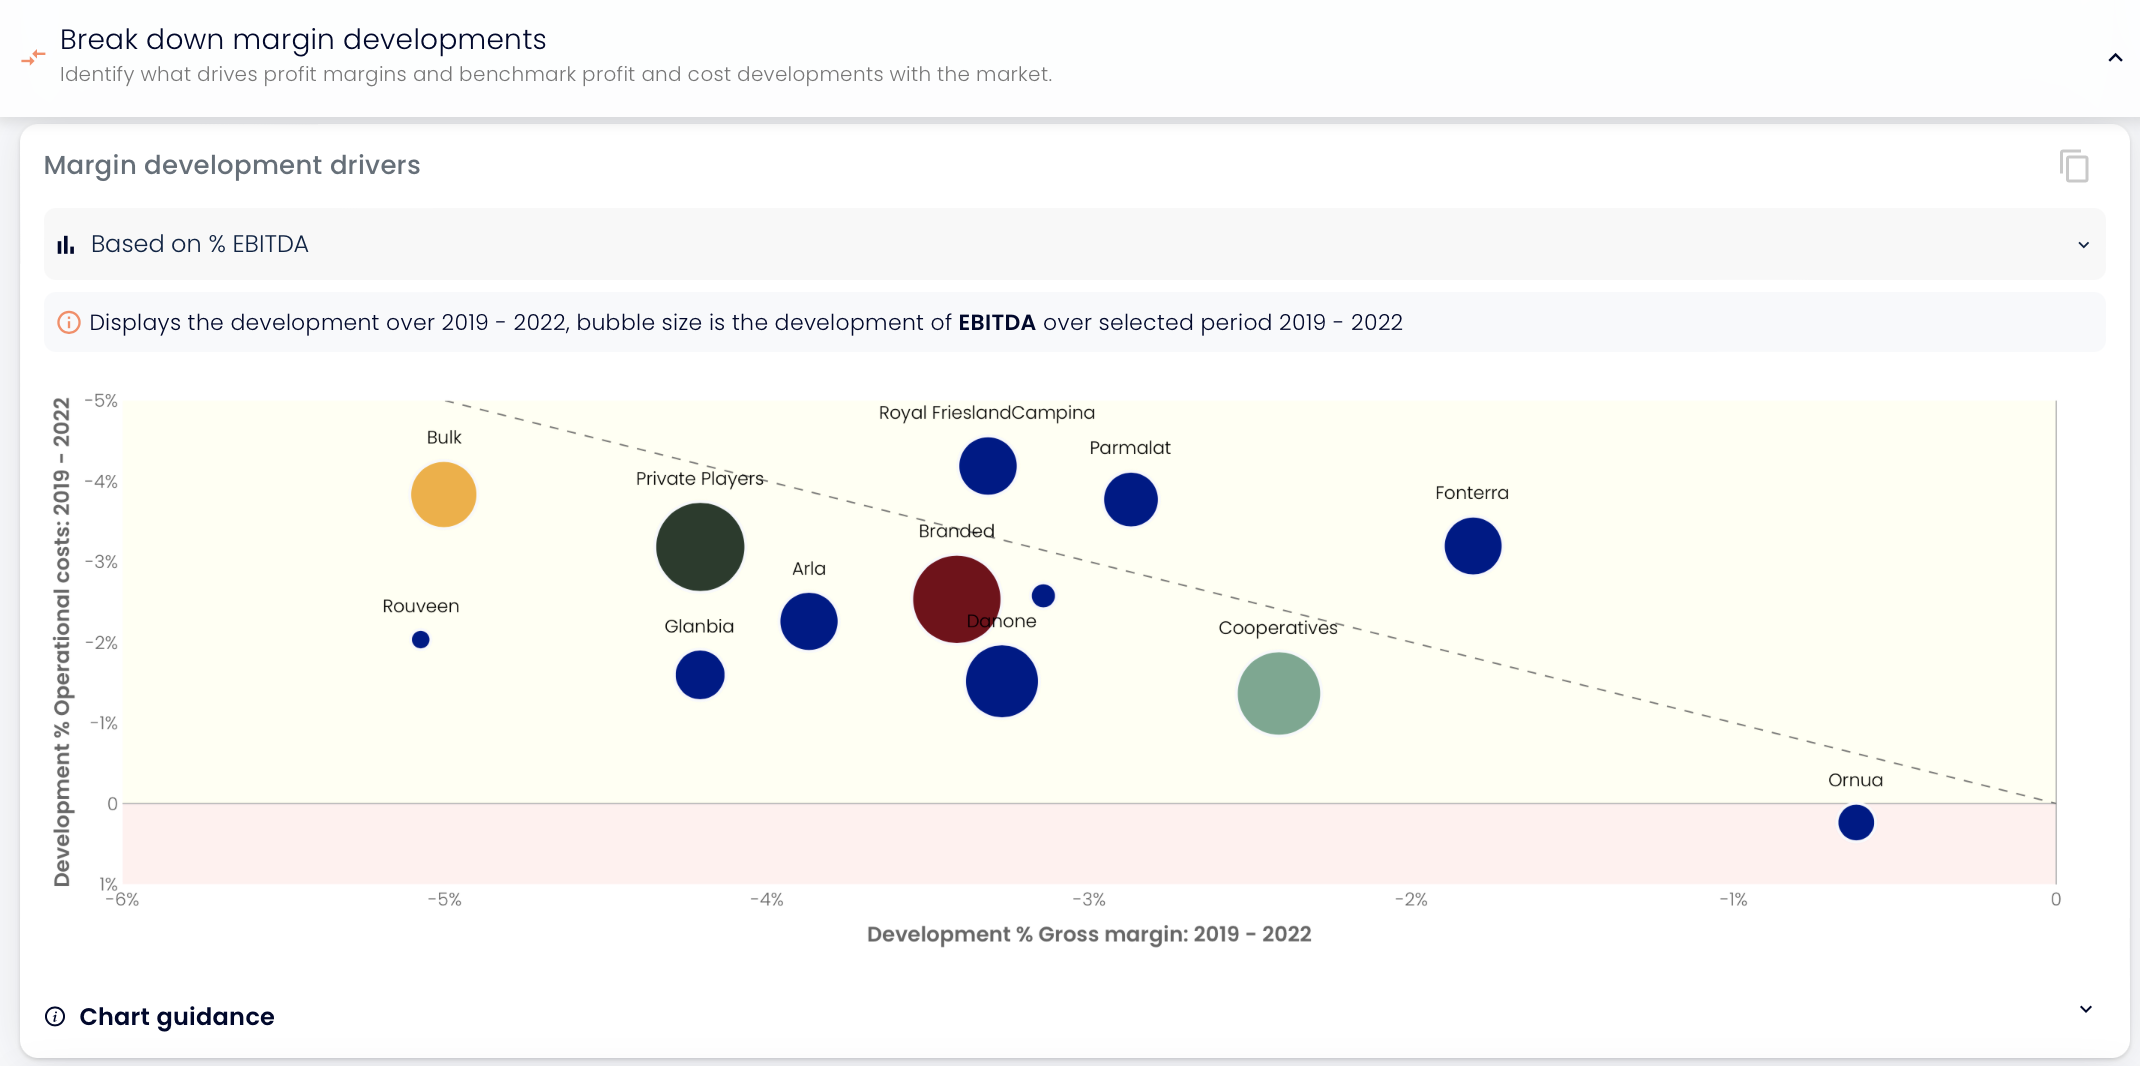
You can also learn a lot from top performers. For example, Rouveen has succeeded by focusing on making high-value specialty cheeses in a fully automated facility.
Welcome to the Reporting stage
The A-INSIGHTS Benchmarks suite makes it easy to gain valuable insights in just a few clicks, simplifying the preparation for your quarterly business review. It offers an objective view of industry success factors, cutting through guesswork and noise in discussions. When combined with your own data and expertise, it helps guide conversations on:
• Future strategies,
• Targets and budget,
• Performance enhancements.